In my last article, we focused on creating topic models for text data. Today, we will focus on clustering text documents. At first sight, topic modeling and document clustering seem to be the same thing. But there is a subtle difference between the two. Topic modeling helps find latent topics in all documents, which we can think of as the hidden treasures/most discussed elements in a set of documents. On the other hand, document clustering is about grouping documents into different homogeneous categories. This can help discover certain common patterns/traits among similar documents that are helpful for specific use cases like segmenting news articles, grouping comments/forum discussions, etc.
Instead of using some random open-source data from the internet, I chose to use the articles at DZone for this demonstration. I randomly picked up different articles from different Zones on DZone and checked whether the code correctly segmented them as per the Zones.
Documents Clustering Process
This is primarily a two-step process.
Step 1
Preprocess the documents to convert them into word vectors. The DTM (document term matrix) is a numerical representation of each document where the value of each term indicates the importance of that term in the document.
One of the most decisive judgments that arises while clustering is whether to use DTM or TDM for clustering. As a rule of thumb, in DTM, the documents are rows and terms are columns, while in TDM, the terms are rows and documents are columns.
If we want to cluster documents, DTM is more appropriate, as the document forms the instances and the terms are the attributes that contribute in grouping the documents. Sometimes, we might face a situation where the objective is term clustering. In this case, we can go with TDM — but topic modeling is really better-suited for this kind of use case.
Step 2
The matrix is then fed to clustering algorithms to group similar instances (i.e. documents) together into clusters.
Easy, right? Well, it is. But the only thing to watch out for is noise in the text. Preparing text and cleaning it to create a model is a Herculean task.
We will continue our example from my previous article. We have added three more DZone articles from different zones to illustrate the clustering process better.
- Documents 1 and 2:These are two Big Data Zone articles written by me.
- Document 3:A Cloud Zone spotlight article from the week of December 3, 2017.
- Documents 4 and 5: Two database zone articles that were spotlighted for the same week.
The texts are unlabelled, and we will use clustering algorithms to group the documents based on their similarity. We will follow the document clustering process and preprocess the documents into a DTM. The below code is reused from our previous article. In short, the code will tokenize the articles and reduce feature space by removing numbers, punctuation, stop words, etc. The corpus will then be converted to a DTM.
library(tm)
library(SnowballC)
#set working directory (modify path as needed)
setwd("//Users//sibanjan//datascience//studies//textmining//documentclustering")
#load files into corpus
#get listing of .txt files in directory
filenames <- list.files(getwd(),pattern="*.txt")
#read files into a character vector
files <- lapply(filenames,readLines)
#create corpus from vector
articles.corpus <- Corpus(VectorSource(files))
articleDtm <- DocumentTermMatrix(articles.corpus, control = list(minWordLength = 3));
articleDtm2 <- removeSparseTerms(articleDtm, sparse=0.98)
articles_mat <- as.matrix(articleDtm2)
Once the DTM matrix is prepared, we can use any of the standard ML clustering algorithms to create clusters. The values are numbers and so that distance-based algorithms like hierarchical or k-means work well. The decision to choose which algorithm is better for a use case follows the same rules that we used for clustering structured data. Here, we use the hclust algorithm. We set the number of clusters to 3, as we had articles picked up from three different Zones.
distMatrix <- dist(articles_mat, method="euclidean")
groups <- hclust(distMatrix,method="ward.D")
plot(groups, cex=0.9)
rect.hclust(groups, k=3)
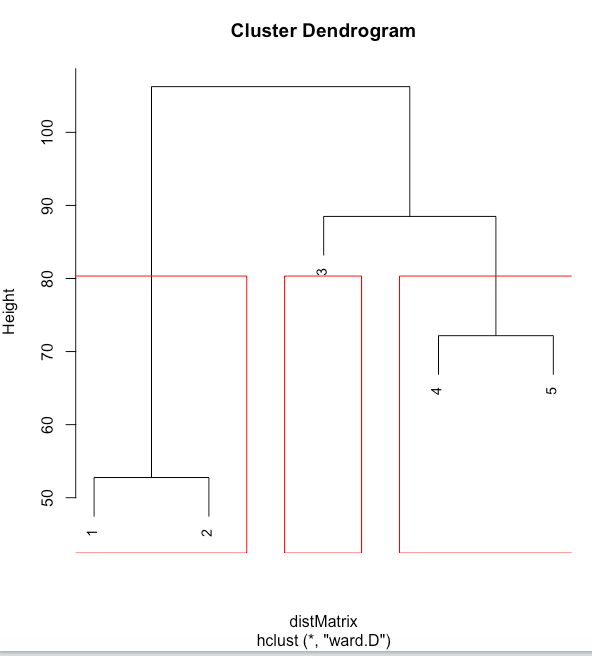
The cluster plot, known as a dendrogram, correctly groups Documents 1 and 2 to one group, Documents 4 and 5 as another group, and Document 3 in a separate group. The code does a fair job of grouping the articles based on the words used in those pieces. The code and data used for this illustration are on my GitHub.
This also proves that DZone editors are doing a fabulous job of assigning the right piece to the correct Zone for us to quickly skim through the knowledge nuggets. Thank you, Sarah Davis (DZone AI and Big Data Zone Editor who spends the best part of her day to read through, assign zone, schedule, and give the final touch to each article submitted for us to learn something new daily).
