The k-means is a simple algorithm that divides the data set into k partitions for n objects where k ≤ n. In this method, the data set is partitioned into homogeneous groups with similar characteristics. The similarity or dissimilarity is defined by calculating the distance between the centroid and data points. The clusters are formed when the optimization function for the algorithm achieves its objective — less intracluster distances and more intercluster distances.
The following steps are involved in traditional k-means clustering:
- Specify the number of clusters and metrics to calculate the
distance - Randomly pick the initial centroid per number of clusters
- For each data point
- Calculate the distance between the centroid and data
points - Assign each data point to the nearest centroid of a cluster
- Calculate the distance between the centroid and data
- Calculate the new centroid for each cluster
- Repeat steps 3 and 4 until the centroids in clusters change.
- Terminate when they remain unchanged in successive cluster reassignments.
Consider the following example in the below figure where we want to cluster five students
into two groups based on their history and geography scores.
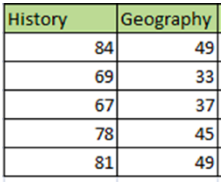
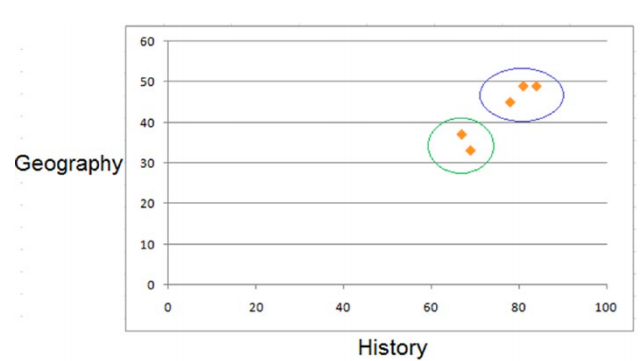
As this is a two-dimensional data set, we plot the history and geography scores for
each student in the x and y-axis, respectively. We can visualize two prominent clusters
from the graph. Let’s run this data through the k-means algorithm and
find out the cluster results.
STEP 1: Specify the number of clusters and metrics to calculate the distance.
As we intend to find two clusters in our sample data set, we set the number of clusters (k) = 2. Assuming the marks are in the same unit and scale, we choose Euclidean distance as the metric for calculating distance. Euclidean distance between a point (x1,y1) and the centroid (cx1,cy2) is given by the following:
dist((x1,y1),(cx2,cy2)) = sqrt((x1-cx2)2+(y1-cy2)2
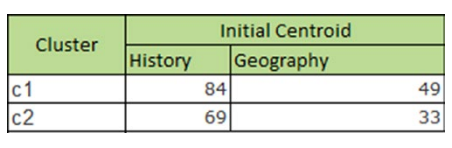
STEP 2: Algorithm finds the initial centroid.
As we are doing the k-means calculation manually, we randomly choose the first two
records to be the initial centroids
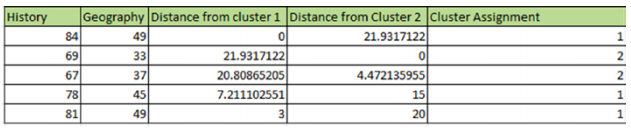
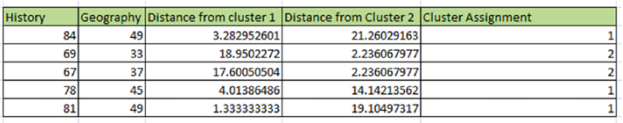
STEP 3: Calculate the distance between the centroid and each data point.
Using the Euclidean formula given in the equation, we calculate the distance of each
data point from each cluster. The closest cluster centroid was assigned a cluster for the
respective data point.
STEP 4: The new centroid/mean for each cluster is recalculated.
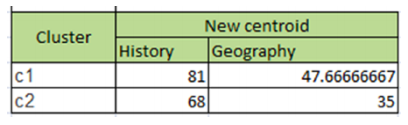
STEP 5: The distance between data points and cluster centroids are again calculated. As the cluster assignment doesn’t change, we get our two final clusters. If we compare the clusters in the plot and in the below figure, we find the k-means algorithm has discovered the same clusters.
The above blog, explaining the concepts of K-Means clustering, is an excerpt from my book Data Science Using Oracle Data Miner and Oracle R Enterprise.
