The following blog, explaining the concepts of building a simple pipeline, is an excerpt from the book Hands-On Automated Machine Learning, written by Sibanjan Das and Umit Mert Chakmak.
There are many moving parts in a Machine Learning (ML) model that have to be tied together for an ML model to execute and produce results successfully. This process of tying together different pieces of the ML process is known as a pipeline. A pipeline is a generalized but very important concept for a Data Scientist. In software engineering, people build pipelines to develop software that is exercised from source code to deployment. Similarly, in ML, a pipeline is created to allow data flow from its raw format to some useful information. It provides a mechanism to construct a multi-ML parallel pipeline system in order to compare the results of several ML methods.
Each stage of a pipeline is fed data processed from its preceding stage; that is, the output of a processing unit is supplied as the input to the next step. The data flows through the pipeline just as water flows in a pipe. Mastering the pipeline concept is a powerful way to create error-free ML models, and pipelines are a crucial element of an AutoML system.
A Simple Pipeline
We will first import a dataset known as Iris, which is already available in scikit-learn’s sample dataset library (http://scikit-learn.org/stable/auto_examples/datasets/plot_iris_dataset.html). The dataset consists of four features and has 150 rows. We will be developing the following steps in a pipeline to train our model using the Iris dataset. The problem statement is to predict the species of an Iris data using four different features, as shown in the following flowchart:
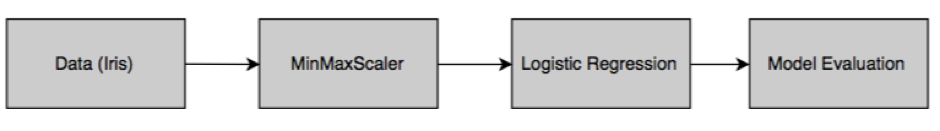
In this pipeline, we will use a MinMaxScaler method to scale the input data and logistic regression to predict the species of the Iris. The model will then be evaluated based on the accuracy measure:
1. The first step is to import from scikit-learn various libraries that will provide methods to accomplish the task. We have to add the Pipeline method from sklearn.pipeline, which will provide us with the necessary methods needed to create an ML pipeline:
from sklearn.datasets import load_iris
from sklearn.preprocessing import MinMaxScaler
from sklearn.linear_model import LogisticRegression
from sklearn.model_selection import train_test_split
from sklearn.pipeline import Pipeline
2. The next step is to load the iris data and split it into training and test datasets. In this example, we will use 80% of the dataset to train the model and the remaining 20% to test the accuracy of the model. We can use the shape function to view the dimension of the dataset:
# Load and split the data
iris = load_iris()
X_train, X_test, y_train, y_test = train_test_split(iris.data, iris.target, test_size= 0.2,random_state=42 )
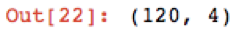
X_train.shape
3. The following result shows that the training dataset has 4 columns and 120 rows, which equates to 80% of the Iris dataset and is as expected:
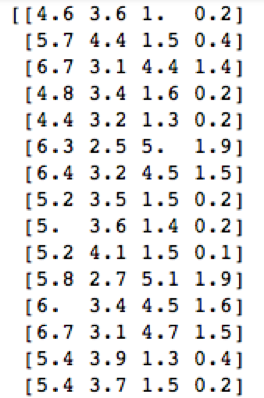
4. Next, we print the dataset:
print(X_train)
The above code yields the following output:
5. The next step is to create a pipeline. The pipeline object is in the form of (key, value) pairs. Key is a string that has the name for a particular step and value is the name of the function or actual method. In the following code snippet, we have named the MinMaxScaler() method as minmax and LogisticRegression() as lr:
pipe_lr = Pipeline([('minmax', MinMaxScaler()),
('lr', LogisticRegression())])
6. Then, we fit the pipeline object, pipe_lr, to the training dataset:
pipe_lr.fit(X_train, y_train)
7. On executing the preceding code, you’ll get the following output, which shows the final structure of the fitted model that was built:
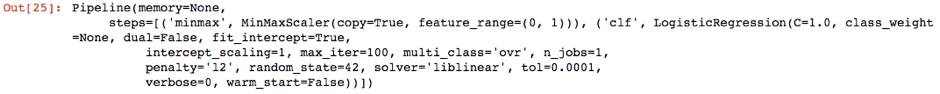
8. The last step is to score the model on the test dataset using the score method:
score = pipe_lr.score(X_test, y_test)
print('Logistic Regression pipeline test accuracy: %.3f' % score)
As we can note from the following results, the accuracy of the model is 0.900, which is 90%:

In this example, we created a pipeline constituting of two steps, that is, minmax scaling and LogisticRegression. When we executed the fit method on pipe_lr, the MinMaxScaler performed a fit and transform method on the input data, and it was passed on to the estimator, which is a logistic regression model. These intermediate steps in a pipeline are known as transformers, and the last step is an estimator.
