• Welcome !
  • Mail us: contact@analytickast.com
Analytickast.com Analytickast.com
  • Home
  • Blog
  • Coaching
    • Course Dashboard
    • Instructor Registration
    • Student Registration
  • Shop Now
  • Contact Us
  • My account
    • Cart
    • Checkout
  • Log In

Signup

How to Cluster Images With the K-Means Algorithm

How to Cluster Images With the K-Means Algorithm

Learn how to read an image and cluster different regions of the image using the k-means algorithm and the SciPy library.

In this article, we will explore a method to read an image and cluster different regions of the image. Image segmentation is an essential topic in an image processing framework. It is the process to classify an image into different groups. There are many different methods, and k-means is one of the most popular methods.

In this exercise, we will utilize the SciPy library to read the image as presented in the below code snippet.

%matplotlib inline
import matplotlib.pyplot as plt
from scipy import ndimage
from sklearn import cluster
image = ndimage.imread("sibanjan.jpg")
plt.figure(figsize = (15,8))
plt.imshow(image)

After we import the image, we print it on the screen to validate whether it was successfully uploaded. I uploaded my photograph. It is not the best one that I have, but it was something that I found it quickly on my desktop.

Image title

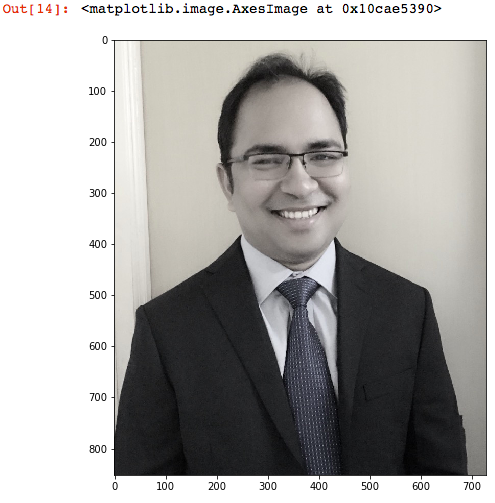
Next, we examine the dimensions of the image. As we can see, it is a three-dimensional array.

image.shape

Image title

For clustering the image, we need to convert it into a two-dimensional array with the length being the 852*728 and width (3) as the RGB value.

x, y, z = image.shape
image_2d = image.reshape(x*y, z)
image_2d.shape

Next, we use scikit-learn’s cluster method to create clusters. We pass n_clusters as 7 to form seven clusters. The clusters appear in the resulting image, dividing it into five parts with distinct colors. The number 7 was chosen heuristically for this demonstration. One can change the number of clusters to visually validate image with different colors and decide that closely matches the required number of clusters.

kmeans_cluster = cluster.KMeans(n_clusters=7)
kmeans_cluster.fit(image_2d)
cluster_centers = kmeans_cluster.cluster_centers_
cluster_labels = kmeans_cluster.labels_

Once the clusters are formed, we can recreate the image with the cluster centers and labels to display the image with grouped patterns.

plt.figure(figsize = (15,8))
plt.imshow(cluster_centers[cluster_labels].reshape(x, y, z))

Image title

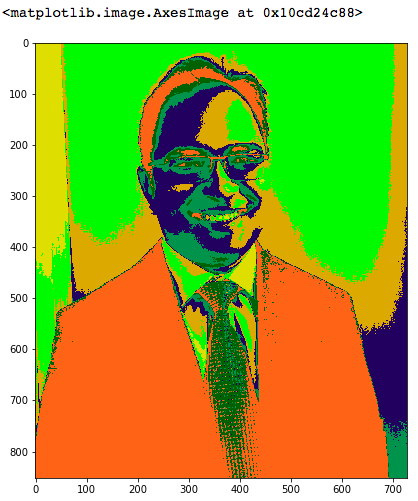
We can view from the above plot that the image is grouped into seven different regions based on the image density.

That’s all for this piece! You can pull the code from my GitHub account.

Categories: Machine Learning
Prev Post
Next Post

Add your Comment

Recent Posts

  • Insights on Data Science Automation for Big Data and IoT Environments
  • The Changing Landscape: Data Science Trends
  • Streamline the Machine Learning Process Using Apache Spark ML Pipelines
  • Dive Deep Into Deep Learning
  • CEP Patterns for Stream Analytics

Recent Comments

    Archives

    • June 2020

    Post Categories

    • Business Analytics
    • Machine Learning
    • Popular Content

    Meta

    • Log in
    • Entries feed
    • Comments feed
    • WordPress.org

    About AnalyticKast

    Author

    Our goal is to provide easy access to people on data technologies related information to thrive in this digital economy.

    Latest Posts

    Insights on Data Science Automation for Big Data and IoT Environments

    Insights on Data Science Automation for Big Data and IoT Environments

    June 30, 2020

    The Changing Landscape: Data Science Trends

    June 30, 2020

    Streamline the Machine Learning Process Using Apache Spark ML Pipelines

    June 30, 2020

    About Analytickast

    One-stop knowledge services platform that supports individuals connect the dots between technologies and management to build data products. Our goal is to provide easy access to people on data technologies related information to thrive in this digital economy.

    Blogs

    • Business Analytics
    • Machine Learning
    • Popular Content

    Quick Links

    • Home
    • Blog
    • Coaching
    • Shop Now
    • Contact Us
    • My account
    • Log In

    Our Videos

    All Rights Reserved © 2020. - www.analytickast.com .

    • Privacy Policy
    • Legal Disclaimer
    • Terms of Use

    Insert/edit link

    Enter the destination URL

    Or link to existing content

      No search term specified. Showing recent items. Search or use up and down arrow keys to select an item.