Assessing the performance of a machine learning model is an essential step in a predictive modeling pipeline. Once a model is ready, it has to be evaluated to establish its correctness. Building a model is easy, but creating a useful model is difficult. Assessing the usefulness of an ML model is a two-phase process. First, a model is evaluated for its statistical accuracy, that is, whether the statistical assumptions are correct, model performance is excellent, and the performance holds true for other unknown datasets. This step is performed using several evaluation metrics. Second, a model is evaluated to see if it performs as per business requirements and if users genuinely get some insights or useful predictions out of it.
In this article, we will walk you through some of the widely used evaluation metrics used to assess a classification model.
1. Confusion matrix: The confusion matrix is the primary method used to validate a classifier. Most of the model quality and accuracy metrics are based on the values of the confusion matrix. This matrix is a table that contains information about the actual and predicted values for a classifier. It typically looks like the figure below for a binary classifier.
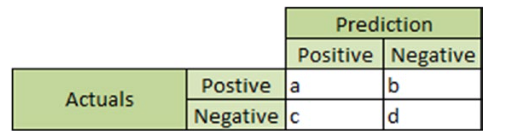
The data in the confusion matrix have the following meaning:
- “a” is the number of positive class predictions that were correctly identified
- “b” is the number of incorrect predictions for actual positive cases
- “c” is the number of incorrect predictions for negative cases
- “d” is the number of negative class predictions that were correctly identified
- Accuracy: Accuracy measures how often the classifier makes a correct prediction. It is the ratio of the number of correct predictions to the total number of predictions.
Accuracy = (a+d)/a+b+c+d
- Precision: Precision measures the proportions of true positives that were correctly identified.
Precision = a/a+c
- Recall: Recall is also termed “sensitivity” or “true positive rate.” It measures the proportions of true positives out of all observed positive values of a target.
Recall = a/a+b
- Misclassification rate: It measures how often the classifier has predicted incorrectly
Misclassification rate = (c + b)/(a+b+c+d)
- Specificity: Specificity is also termed a “true negative rate.” It measures the proportions of true negatives out of all observed negative values of a target.
Specificity = d/b+d
- ROC (receiver operating characteristic) curve: The ROC curve is used to summarize the performance of a classifier over all possible thresholds. The graph for ROC curve is plotted with sensitivity/True Positive Rate(TPR) in the y axis and (1 – specificity)/False Positive Rate(FPR) in the x axis for all possible cutpoints (thresholds).
- AUC (area under curve): AUC is the area under a ROC curve. If the classifier is excellent, the sensitivity will increase, and the area under the curve will be close to 1. If the classifier is equivalent to random guessing, the sensitivity will increase linearly with the false positive rate(1 – sensitivity). In this case, the AUC will be around 0.5. As a rule of thumb, the better the AUC measure, the better the model.
- Lift: Lift helps measure the marginal improvement in a model’s predictive ability over the average response. For example, for a marketing campaign, the average response rate is 5%, but a model identifies segments with a 10% response rate. Then that segment has a lift of 2 (10%/5%).
- Balanced Accuracy: When the data set is unbalanced, the accuracy might not be a good measure alone to evaluate a model. A model built with unbalanced data is biased towards the most occurring class. Balanced accuracy is a measure calculated on the average accuracy obtained in either class.
Balanced Accuracy = 0.5*((a/(a+b))+(d/(c+d))
- F1 Score: F1 Score is also considered as a good measure to evaluate an imbalanced classifier. F1 score is the harmonic mean of precision and recall. Its value lies in between 0 and 1.
F1 Score = 2* PR/(P+R)
Some parts of this article is from my book Data Science with Oracle Data Miner and Oracle R Enterprise. You can try my book to know more about Machine Learning algorithms, Data Preprocessing techniques and much more.
